

The Challenge
In the fast-paced world of construction management, the ability to make informed decisions based on real-time data is crucial to project success. For companies using Procore, the question often arises: Is it better to upgrade to Procore’s Analytics tool or rely on Procore’s built-in project dashboards and custom reports to deliver the same results while reducing costs? And how can leaders keep their teams accountable for using Procore across all projects?
Benefits of Visual Reporting
For Leadership:
- Creates the ability to view which company users are actively using Procore, enabling leadership to hold their teams accountable
- Enables informed decision making through increased project visibility at the company level
For Project Teams:
- Allows for more comprehensive visibility with views across multiple projects within a company
- Provides simple method for auditing vendors or tools that have pain points, creating starting point for targeted trainings
- Saves time with hyperlinked fields, allowing users to drill into specific areas of concern for further detail
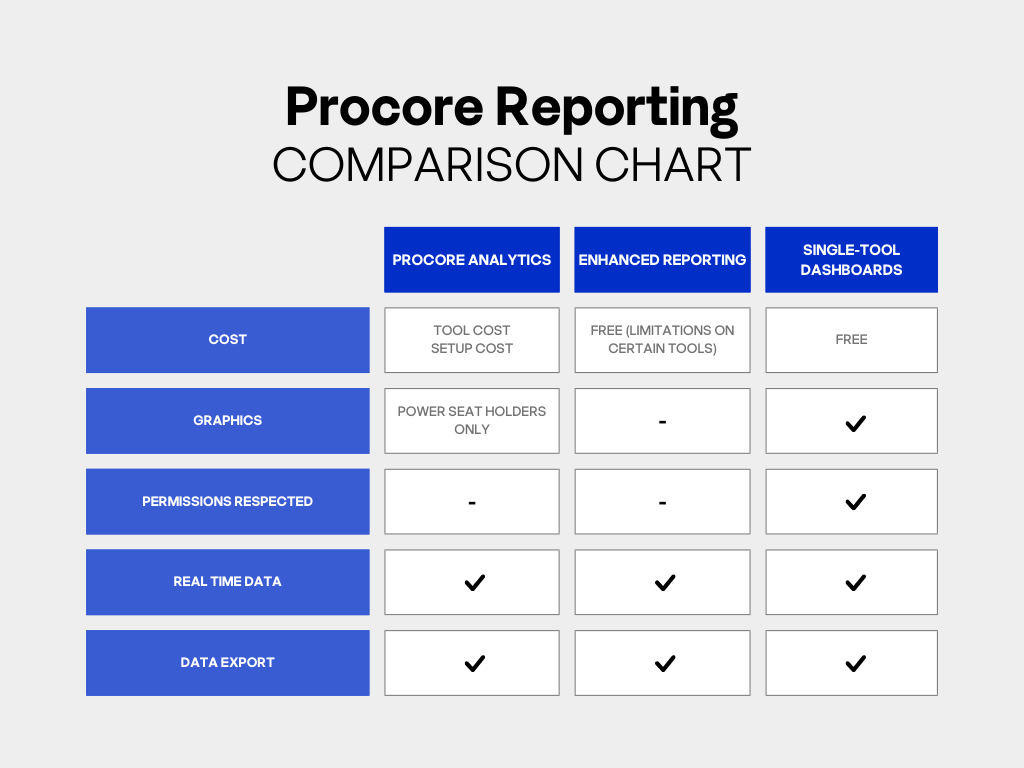
Procore Analytics 2.0 vs. Single-Tool Reporting: A Clear Comparison Solution
Procore’s Analytics package offers powerful insights but comes with a catch—its visuals are only accessible to users with Power BI licenses and it comes at an added cost. This licensing structure can quickly become cost-prohibitive, especially for companies with many users who don’t necessarily need full access to the analytics tool.
Our Managed Services team made up of Procore experts recommends a more cost-effective approach to clients: creating custom reports and dashboards using Procore’s native project management tools. These dashboards are accessible to all users, eliminating the need for additional licenses. Custom reports and dashboards can be designed with specific insights and company-specific project data in mind, ensuring that key data is available immediately and can be easily acted upon by regional managers, leadership, and even field staff.
Instead of relying on Procore Analytics, our Procore Managed Services team can help companies create tailored, actionable insights through custom dashboards that are accessible to everyone—without the added cost of Power BI licenses and Procore Analytics.
Best Practices for Procore Reporting: Maximizing Dashboard Usefulness
- Identify Key Information: Ensure your reports and dashboards clearly display important details like project names, numbers, and status. This helps users navigate large data sets without confusion.
- Interactive Content for Easy Navigation: Understand which data fields to include, such as title, project ID number, or subject. Include these fields in your visual display to enable users to navigate directly to the item. This hyperlinked data is particularly useful for managers and teams needing to access project details quicky. For example, if creating a graph to highlight overdue submittals, linking the data fields “submittal title” and “project” will enable users to drill down into which submittals are overdue.
- Organize Dashboards Thoughtfully: Avoid overwhelming users by keeping dashboards clean and organized. Group related metrics together, label graphs appropriately, and prioritize data that directly impacts decision-making.
By adhering to these best practices, teams can ensure that their Procore dashboards are not just informative but truly useful—leading to more effective project management and quicker decision-making.
How Procore Dashboards Help Save on Costs
Procore Analytics is a premium add-on service and can include additional costs to integrate with a company’s Power BI account. Rather than paying Procore for analytics setup, companies can use their own team and documented solutions to build analytics solutions that are tailored to their specific needs—cutting out the middleman and the associated costs.
The Outcome
Procore’s native single-tool dashboards allow company leadership to hold teams accountable for using Procore across projects, while also allowing implementation engineers and project managers to have quick visibility into their projects.
The key to success lies in being strategic—focusing on tailored dashboards and reports that provide the right data, at the right time, for the right people—while being mindful of cost efficiency. In an industry where margins can be thin, these strategies can make all the difference.
Vertex Innovations and its Procore Managed Services team helps firms make the most of their Procore investment while improving overall project management. Schedule a call with our experts to experience how we can help your team create powerful reports that project performance.


Ready to get started?
Whether you are looking for construction oversight, project management or help maximizing your Procore investment, we’d love to hear from you!